Monitor your logging pipeline with Prometheus Operator

You can configure the Logging operator to expose metrics endpoints for Fluentd, Fluent Bit, and syslog-ng using ServiceMonitor resources. That way, a Prometheus operator running in the same cluster can automatically fetch your logging metrics.
Metrics Variables
You can configure the following metrics-related options in the spec.fluentd.metrics, spec.syslogNG.metrics, and spec.fluentbit.metrics sections of your Logging resource.
| Variable Name | Type | Required | Default | Description |
|---|---|---|---|---|
| interval | string | No | “15s” | Scrape Interval |
| timeout | string | No | “5s” | Scrape Timeout |
| port | int | No | - | Metrics Port. |
| path | int | No | - | Metrics Path. |
| serviceMonitor | bool | No | false | Enable to create ServiceMonitor for Prometheus operator |
| prometheusAnnotations | bool | No | false | Add prometheus labels to fluent pods. |
For example:
spec:
  fluentd:
    metrics:
      serviceMonitor: true
  fluentbit:
    metrics:
      serviceMonitor: true
  syslogNG:
    metrics:
      serviceMonitor: true
For more details on installing the Prometheus operator and configuring and accessing metrics, see the following procedures.
Install Prometheus Operator with Helm
-
Create
loggingnamespacekubectl create namespace logging -
Install Prometheus Operator
helm repo add prometheus-community https://prometheus-community.github.io/helm-chartshelm upgrade --install --wait --create-namespace --namespace logging monitor prometheus-community/kube-prometheus-stack \ --set "grafana.dashboardProviders.dashboardproviders\\.yaml.apiVersion=1" \ --set "grafana.dashboardProviders.dashboardproviders\\.yaml.providers[0].orgId=1" \ --set "grafana.dashboardProviders.dashboardproviders\\.yaml.providers[0].type=file" \ --set "grafana.dashboardProviders.dashboardproviders\\.yaml.providers[0].disableDeletion=false" \ --set "grafana.dashboardProviders.dashboardproviders\\.yaml.providers[0].options.path=/var/lib/grafana/dashboards/default" \ --set "grafana.dashboards.default.logging.gnetId=7752" \ --set "grafana.dashboards.default.logging.revision=5" \ --set "grafana.dashboards.default.logging.datasource=Prometheus" \ --set "prometheus.prometheusSpec.serviceMonitorSelectorNilUsesHelmValues=False"Prometheus Operator Documentation The prometheus-operator install may take a few more minutes. Please be patient. The logging-operator metrics function depends on the prometheus-operator’s resources. If those do not exist in the cluster it may cause the logging-operator’s malfunction.
Install Logging operator with Helm
-
Install the Logging operator into the logging namespace:
helm upgrade --install --wait --create-namespace --namespace logging logging-operator oci://ghcr.io/kube-logging/helm-charts/logging-operatorExpected output:
Release "logging-operator" does not exist. Installing it now.
Pulled: ghcr.io/kube-logging/helm-charts/logging-operator:4.3.0
Digest: sha256:c2ece861f66a3a2cb9788e7ca39a267898bb5629dc98429daa8f88d7acf76840
NAME: logging-operator
LAST DEPLOYED: Wed Aug  9 11:02:12 2023
NAMESPACE: logging
STATUS: deployed
REVISION: 1
TEST SUITE: None
Note:
-
Helm has a known issue in version 3.13.0 that requires users to log in to the registry, even though the repo is public.
Upgrade to 3.13.1 or higher to avoid having to log in, see: https://github.com/kube-logging/logging-operator/issues/1522
-
If you’re installing the Helm chart from Terraform, reference the repository as
repository = "oci://ghcr.io/kube-logging/helm-charts/"(without thelogging-operatorsuffix). Otherwise, you’ll get a 403 Forbidden error.
-
Install Minio
-
Create Minio Credential Secret
kubectl -n logging create secret generic logging-s3 --from-literal=accesskey='AKIAIOSFODNN7EXAMPLE' --from-literal=secretkey='wJalrXUtnFEMI/K7MDENG/bPxRfiCYEXAMPLEKEY' -
Deploy Minio
kubectl -n logging apply -f - <<"EOF" apiVersion: apps/v1 kind: Deployment metadata: name: minio-deployment namespace: logging spec: selector: matchLabels: app: minio strategy: type: Recreate template: metadata: labels: app: minio spec: containers: - name: minio image: minio/minio args: - server - /data - "--console-address=:9001" readinessProbe: httpGet: path: /minio/health/ready port: 9000 initialDelaySeconds: 10 periodSeconds: 5 env: - name: MINIO_REGION value: 'test_region' - name: MINIO_ROOT_USER valueFrom: secretKeyRef: name: logging-s3 key: accesskey - name: MINIO_ROOT_PASSWORD valueFrom: secretKeyRef: name: logging-s3 key: secretkey - name: MINIO_BROWSER_LOGIN_ANIMATION value: "off" ports: - containerPort: 9000 - containerPort: 9001 volumes: - name: logging-s3 secret: secretName: logging-s3 --- kind: Service apiVersion: v1 metadata: name: nginx-demo-minio namespace: logging spec: selector: app: minio ports: - name: http protocol: TCP port: 9000 targetPort: 9000 - name: console protocol: TCP port: 9001 targetPort: 9001 EOF -
Create
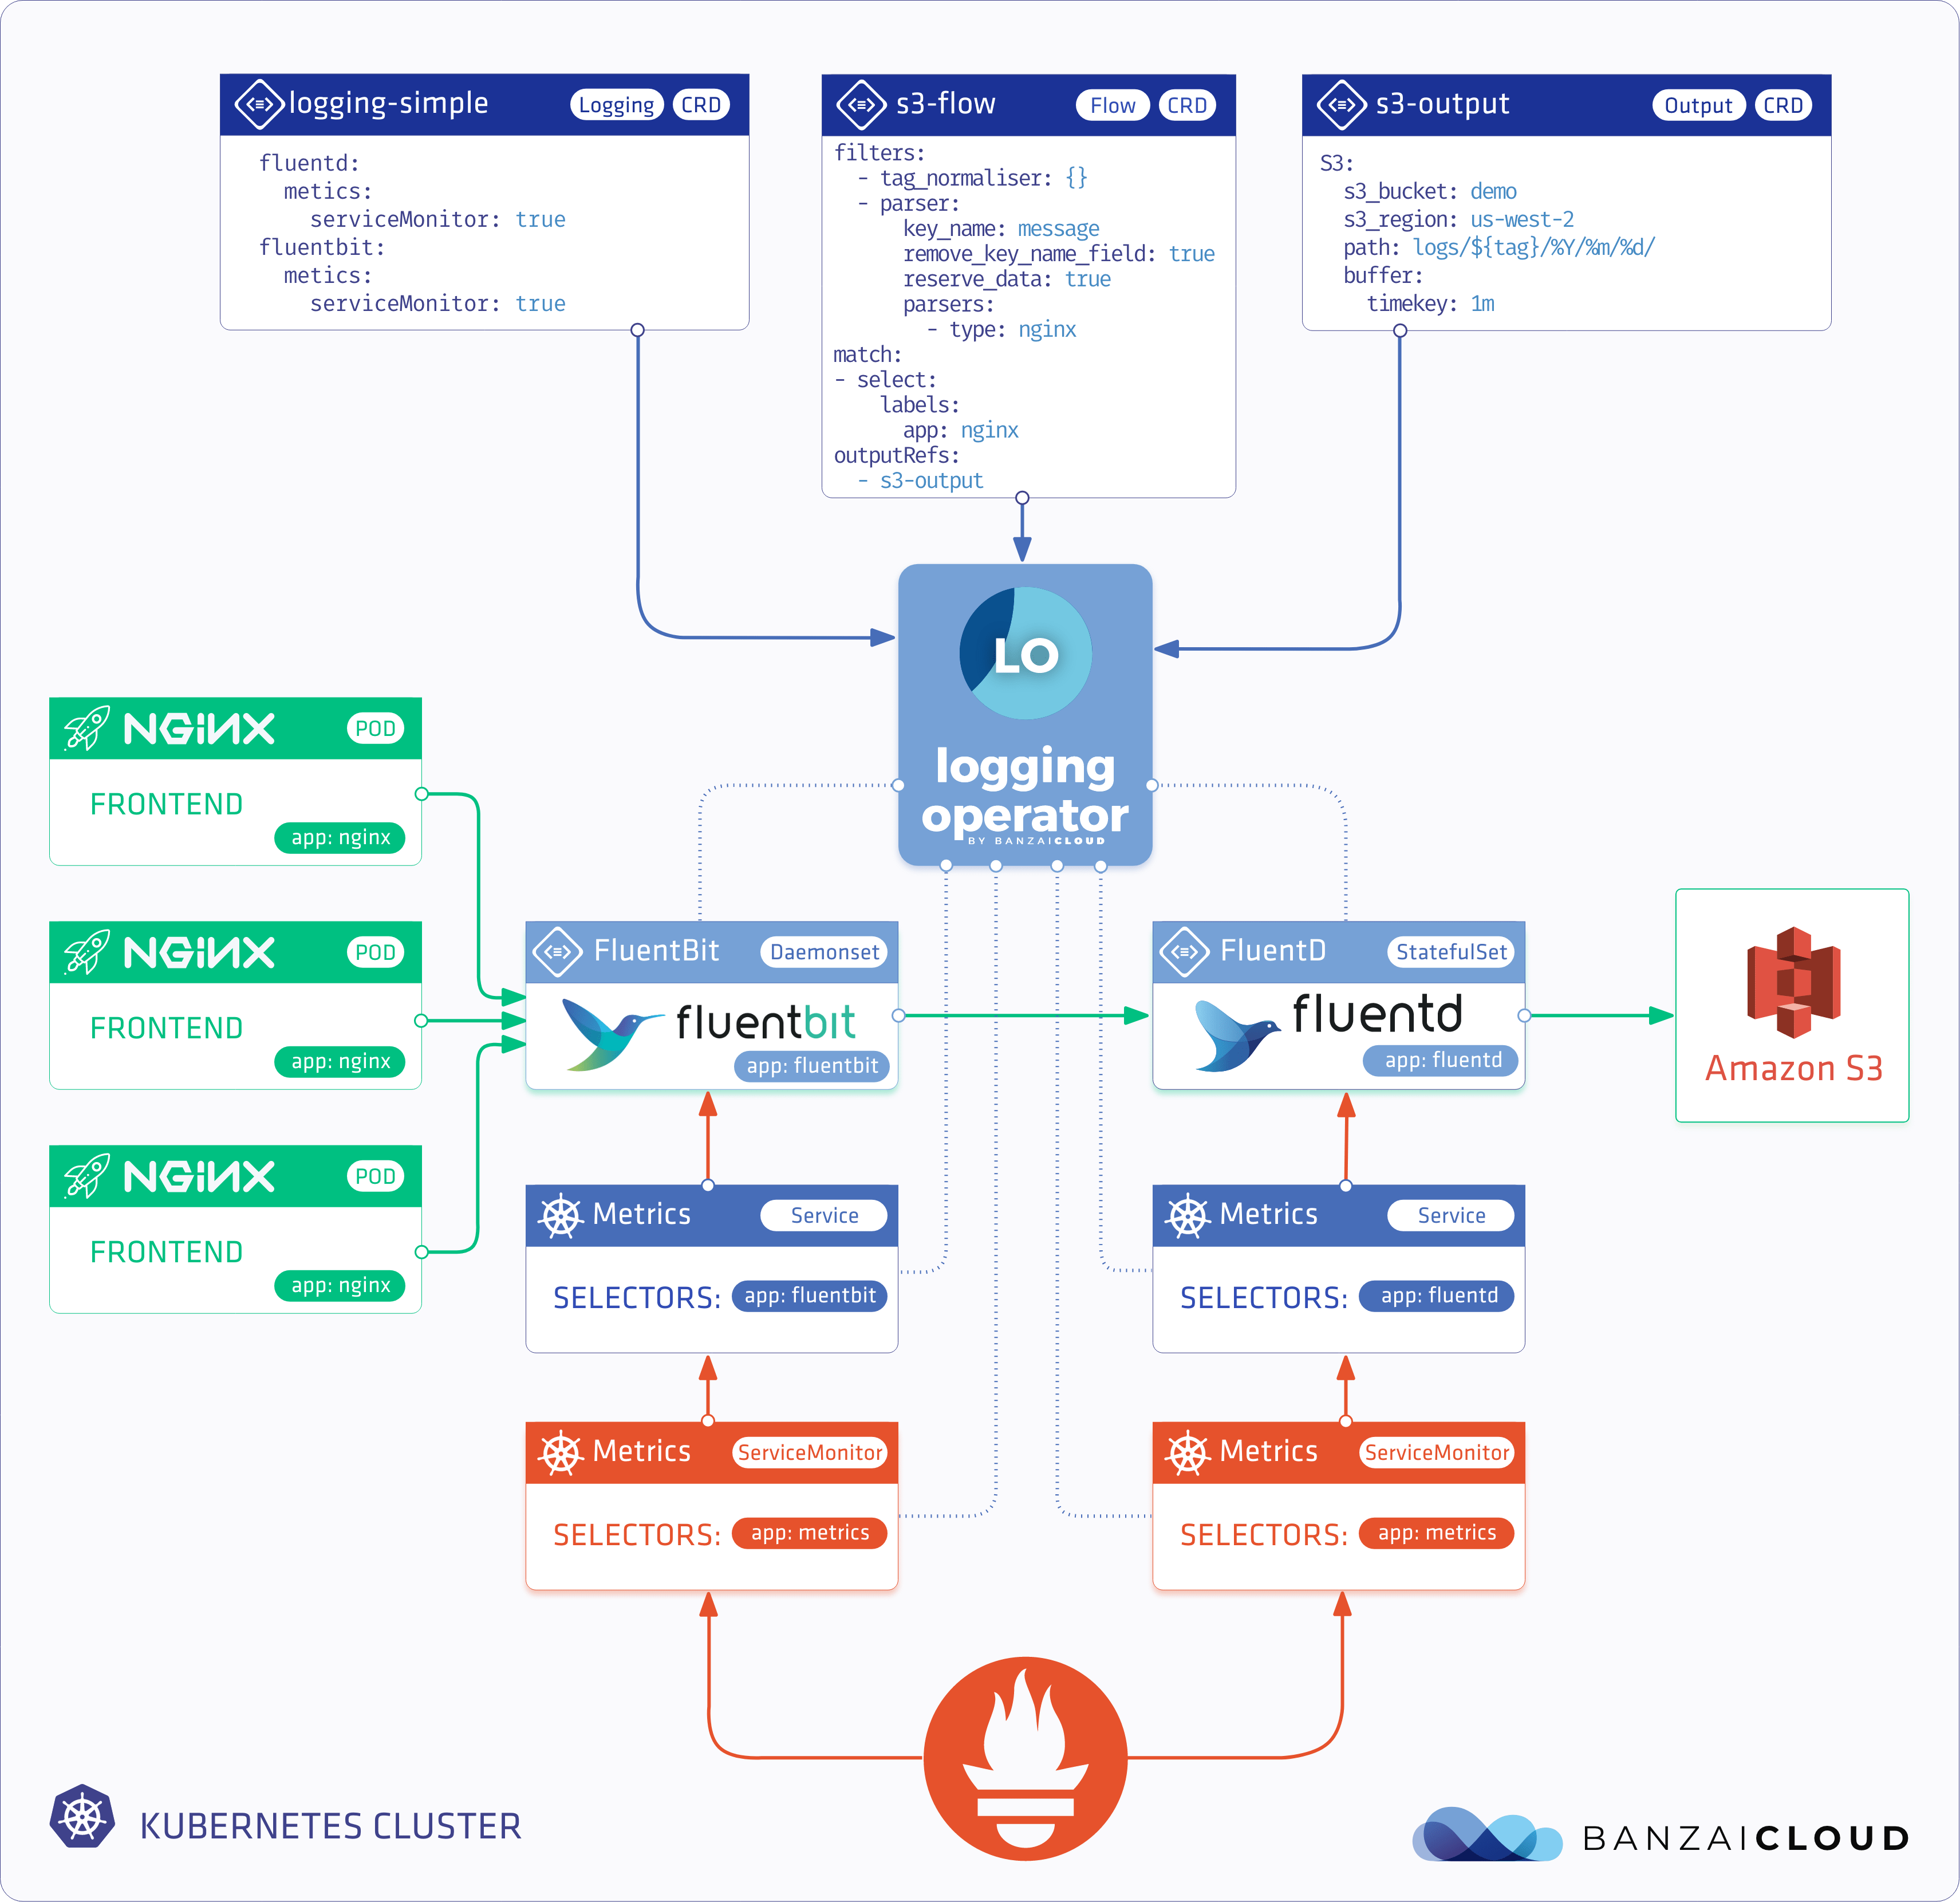
loggingresourcekubectl apply -f - <<"EOF" apiVersion: logging.banzaicloud.io/v1beta1 kind: Logging metadata: name: default-logging-simple spec: fluentd: metrics: serviceMonitor: true fluentbit: metrics: serviceMonitor: true controlNamespace: logging EOFNote:
ClusterOutputandClusterFlowresource will only be accepted in thecontrolNamespace -
Create Minio output definition
kubectl -n logging apply -f - <<"EOF"
apiVersion: logging.banzaicloud.io/v1beta1
kind: Output
metadata:
  name: demo-output
spec:
  s3:
    aws_key_id:
      valueFrom:
        secretKeyRef:
          key: accesskey
          name: logging-s3
    aws_sec_key:
      valueFrom:
        secretKeyRef:
          key: secretkey
          name: logging-s3
    buffer:
      timekey: 10s
      timekey_use_utc: true
      timekey_wait: 0s
    force_path_style: "true"
    path: logs/${tag}/%Y/%m/%d/
    s3_bucket: demo
    s3_endpoint: http://nginx-demo-minio.logging.svc.cluster.local:9000
    s3_region: test_region
EOF
Note: For production set-up we recommend using longer
timekeyinterval to avoid generating too many object. -
Create
flowresourcekubectl -n logging apply -f - <<"EOF" apiVersion: logging.banzaicloud.io/v1beta1 kind: Flow metadata: name: demo-flow spec: filters: - tag_normaliser: {} - parser: remove_key_name_field: true reserve_data: true parse: type: nginx match: - select: labels: app.kubernetes.io/instance: log-generator app.kubernetes.io/name: log-generator localOutputRefs: - demo-output EOF -
Install log-generator to produce logs with the label
app.kubernetes.io/name: log-generatorhelm upgrade --install --wait --create-namespace --namespace logging log-generator oci://ghcr.io/kube-logging/helm-charts/log-generator
Validation
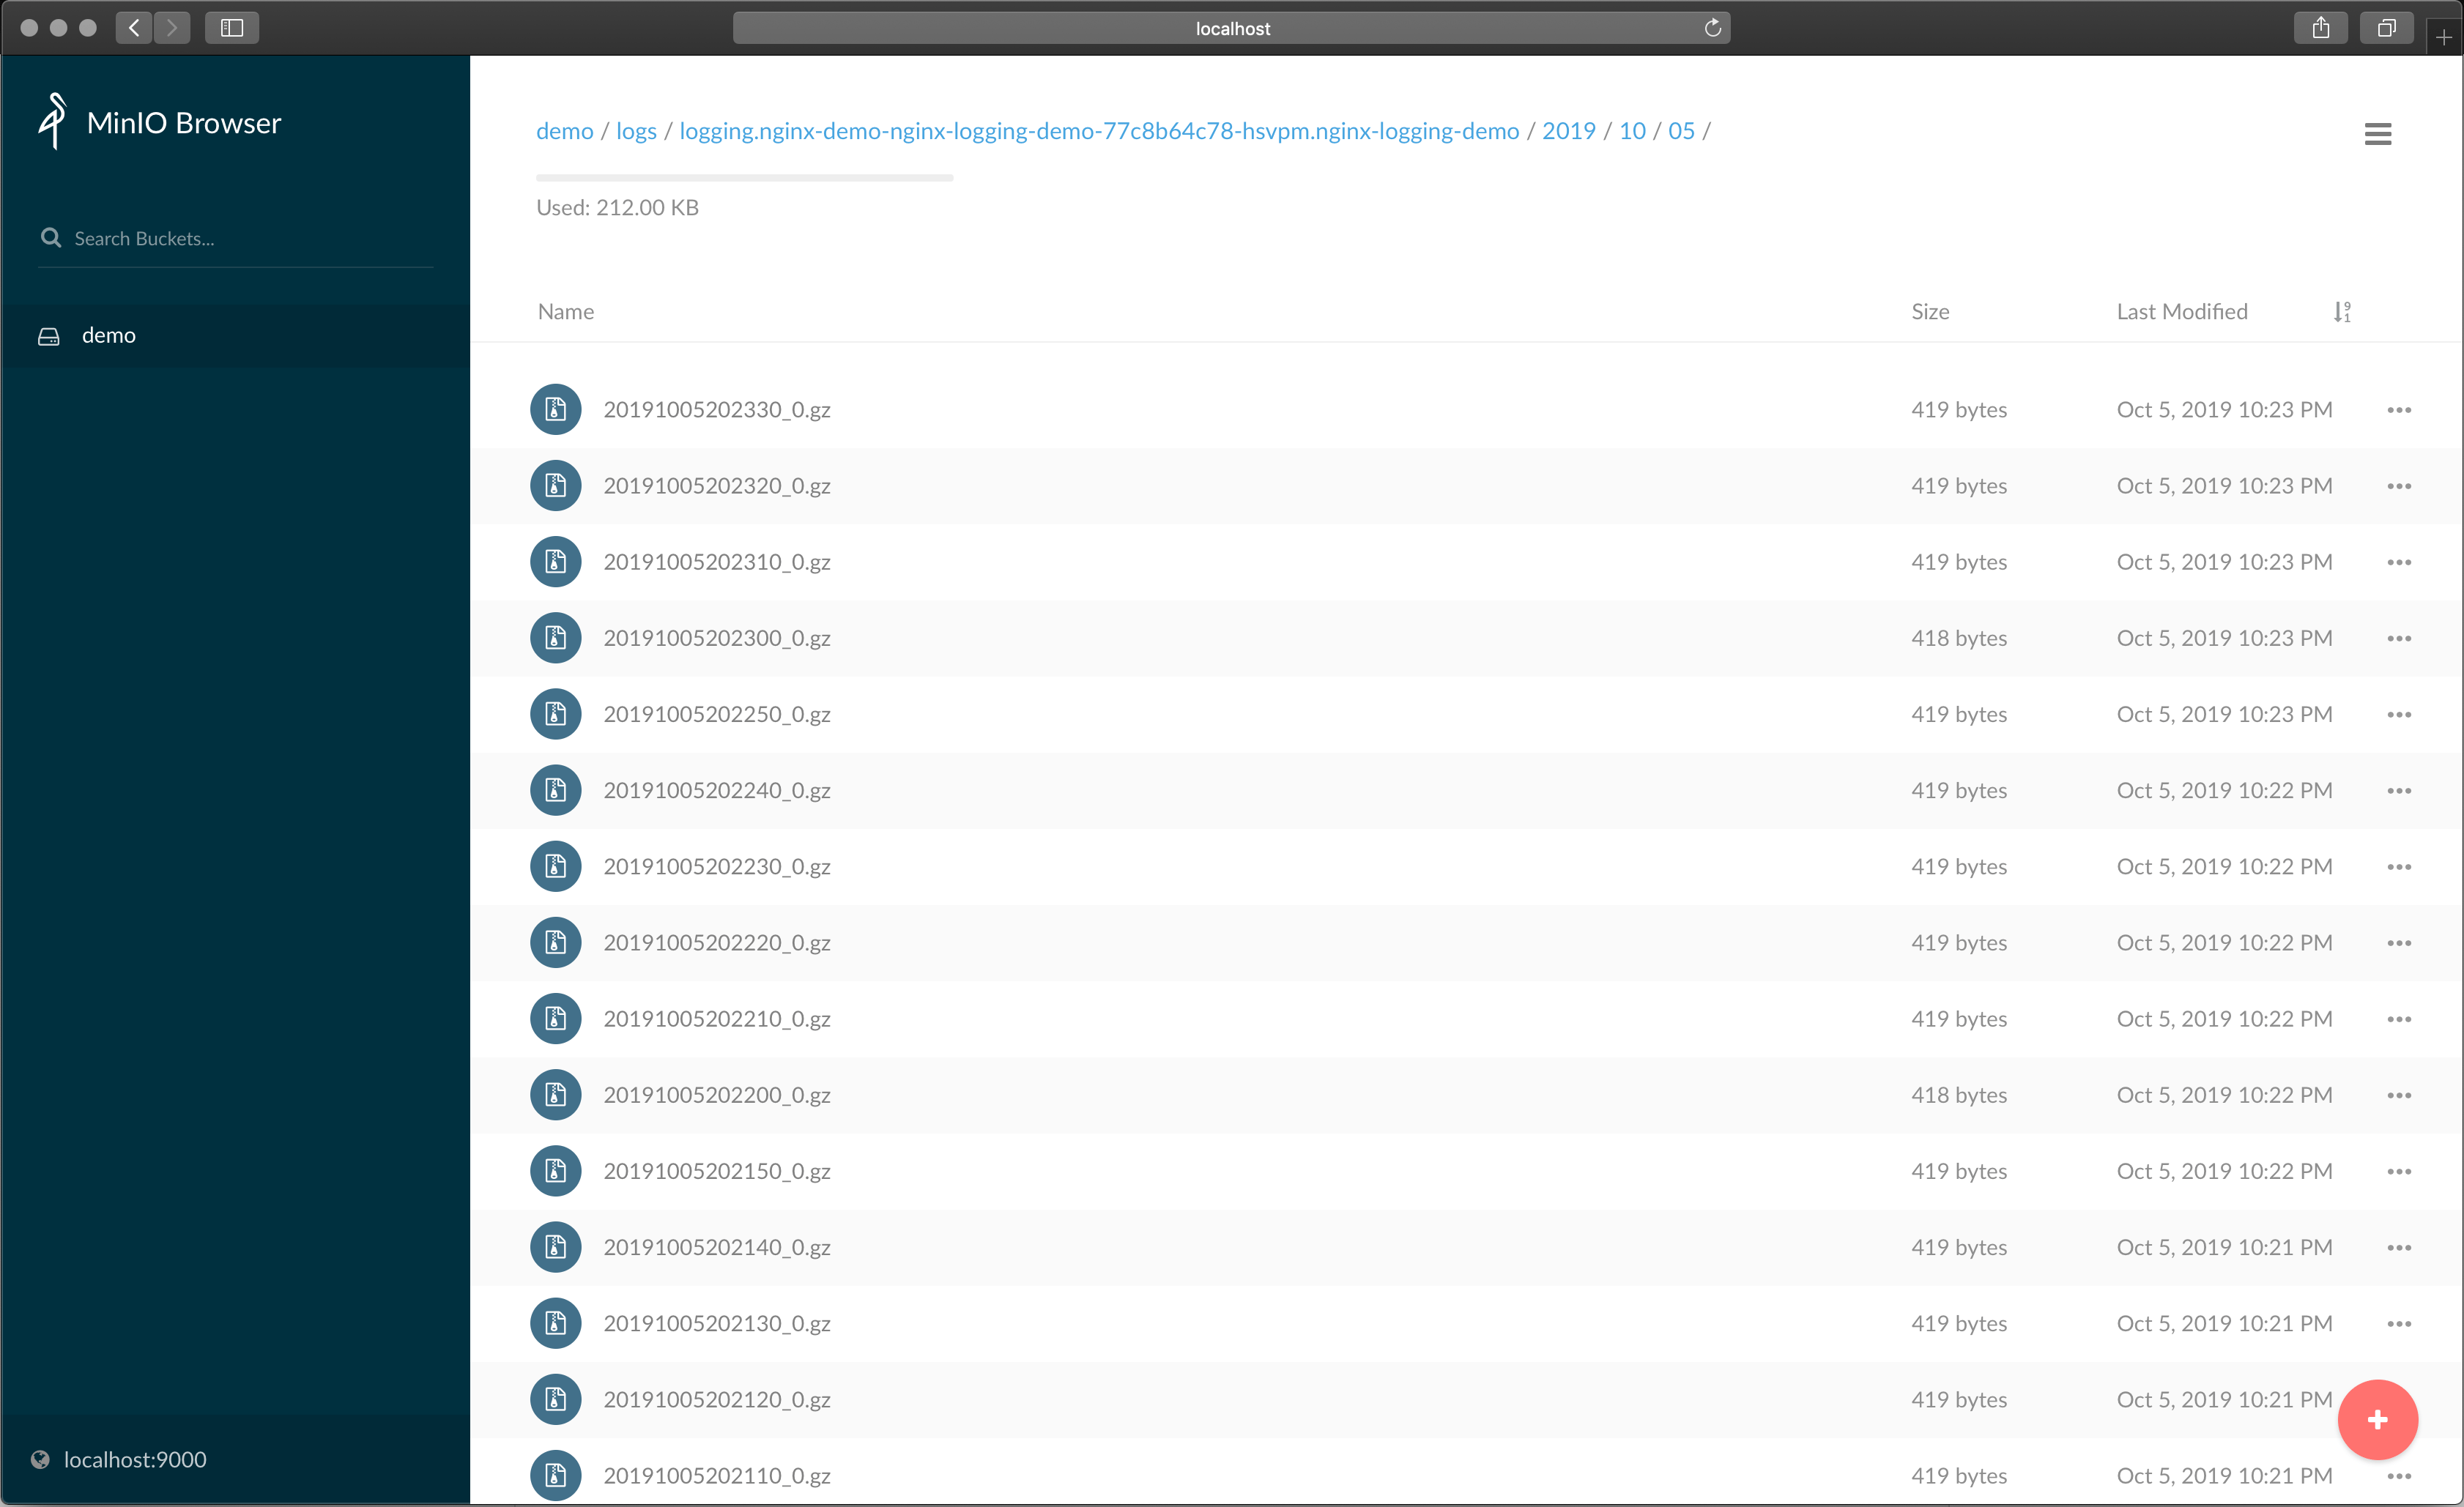
Minio
-
Get Minio login credentials
kubectl -n logging get secrets logging-s3 -o json | jq '.data | map_values(@base64d)' -
Forward Service
kubectl -n logging port-forward svc/nginx-demo-minio 9001:9001 -
Open the Minio Dashboard: http://localhost:9001
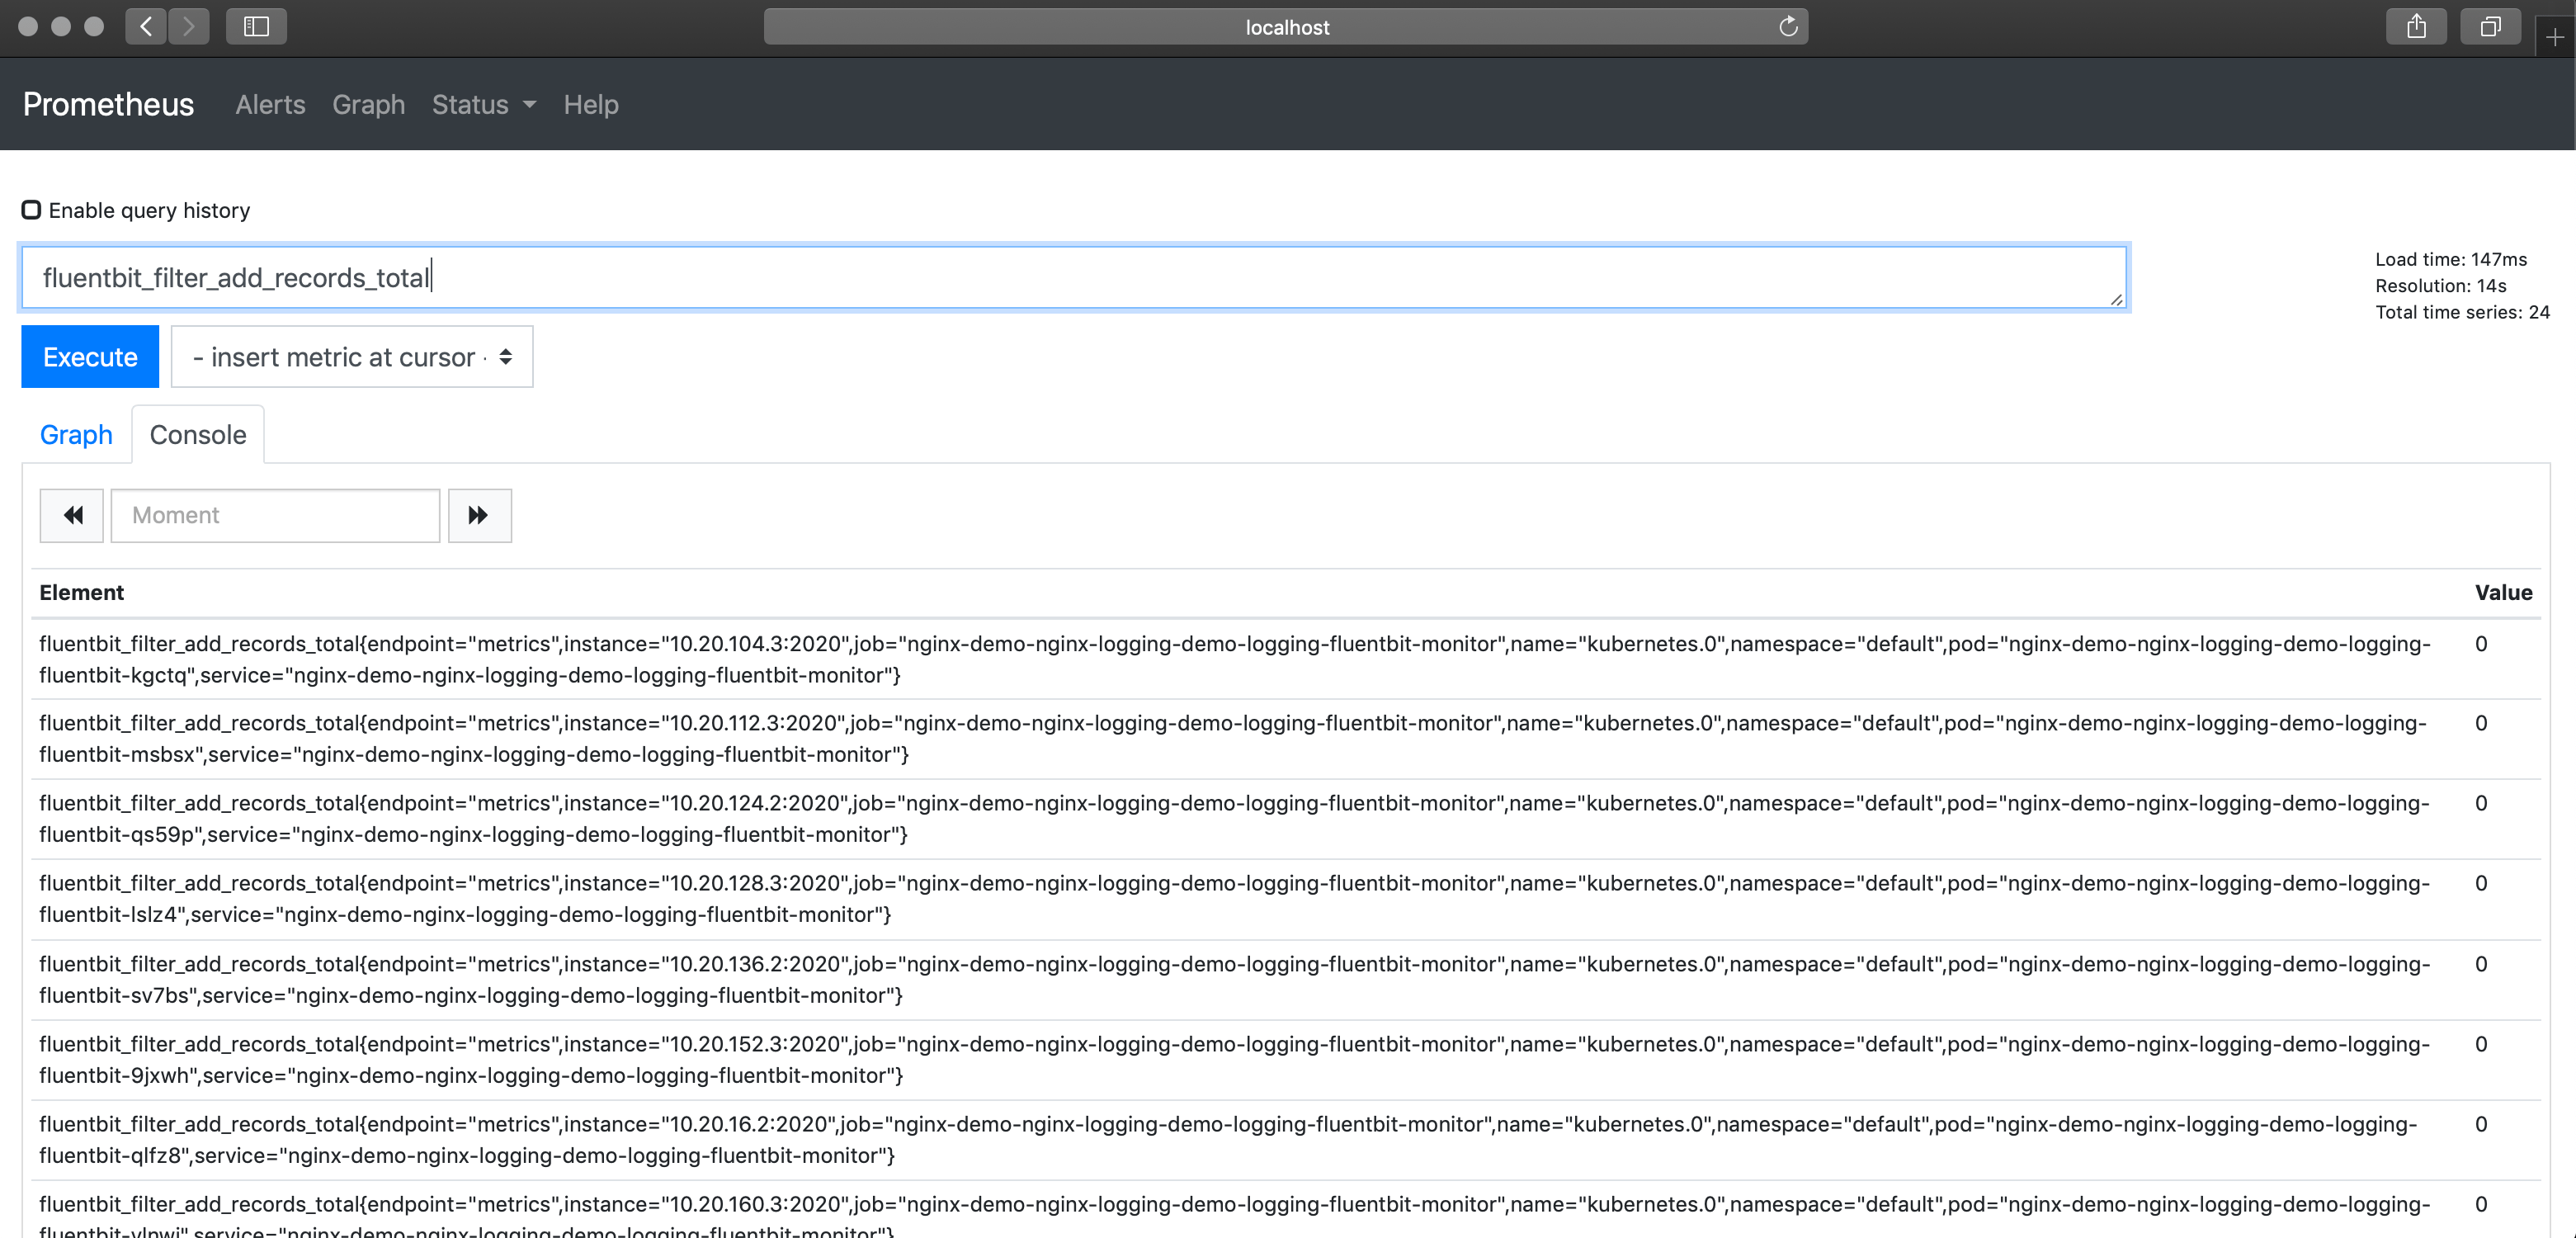
Prometheus
-
Forward Service
kubectl -n logging port-forward svc/monitor-kube-prometheus-st-prometheus 9090 -
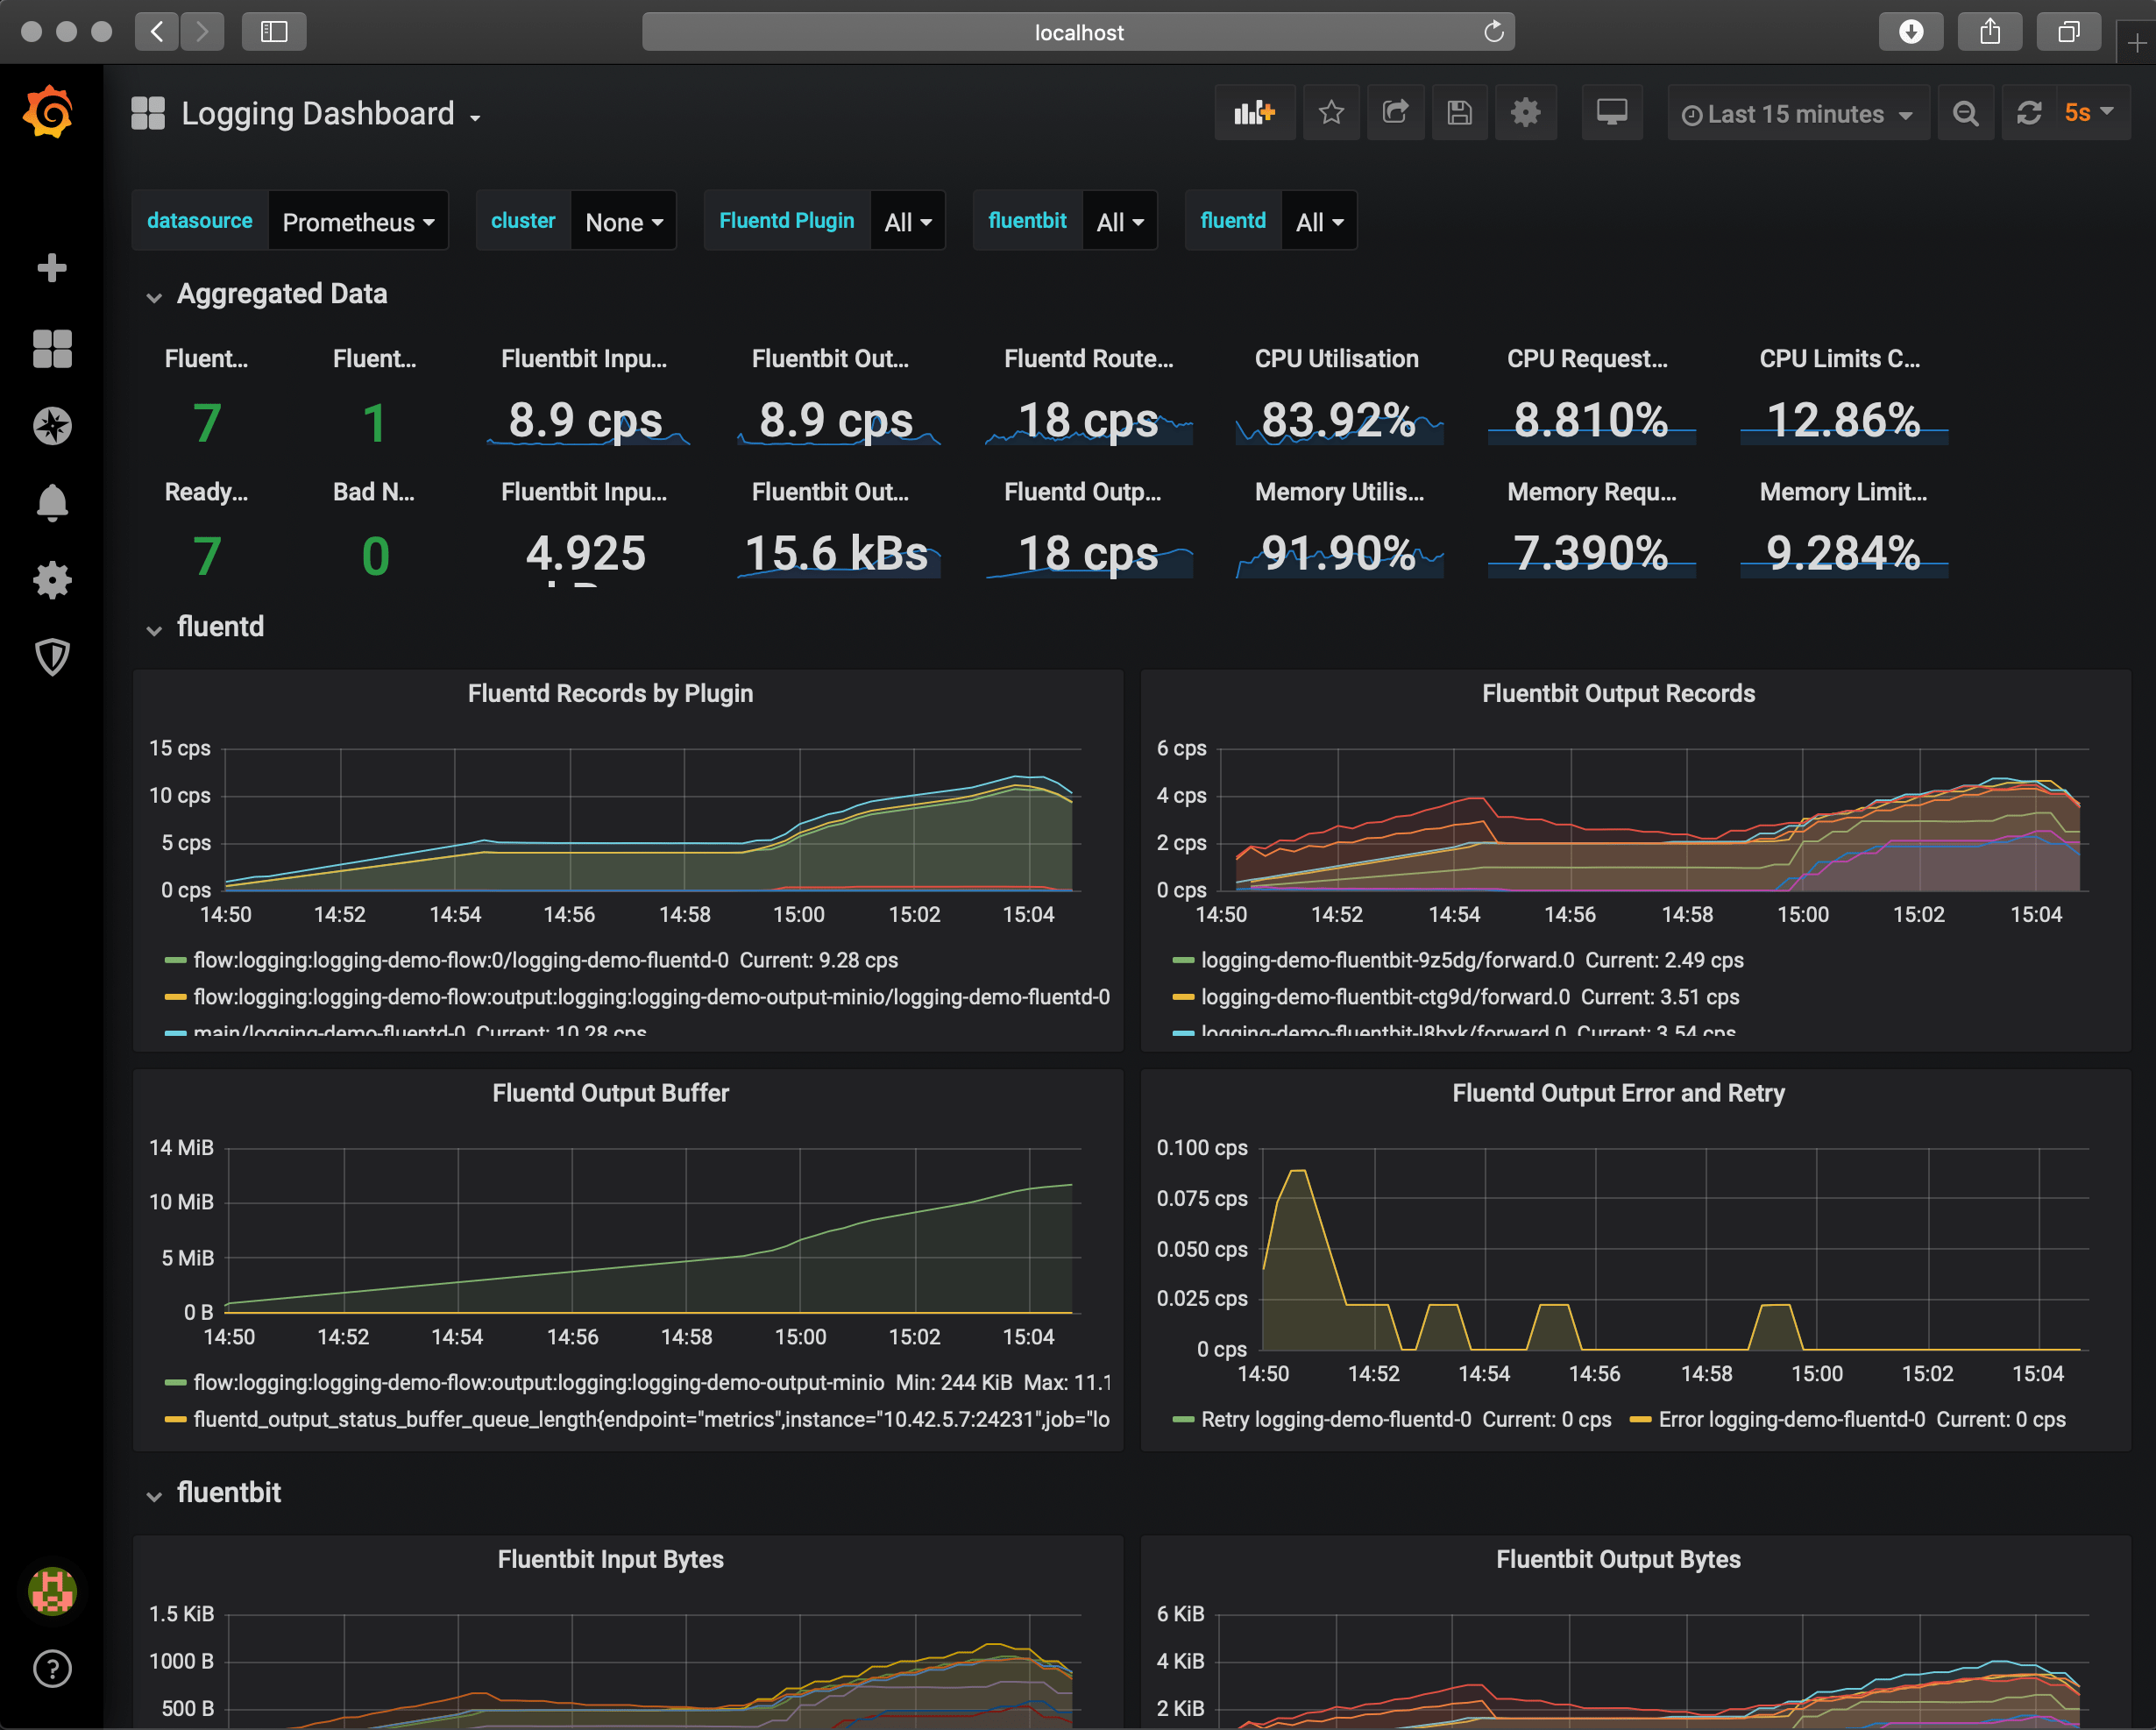
Open the Prometheus Dashboard: http://localhost:9090
Grafana
-
Get Grafana login credentials
kubectl get secret --namespace logging monitor-grafana -o jsonpath="{.data.admin-password}" | base64 --decode ; echoDefault username:
admin -
Forward Service
kubectl -n logging port-forward svc/monitor-grafana 3000:80 -
Open Grafana Dashboard: http://localhost:3000