Store Nginx Access Logs in Grafana Loki with Logging operator
This guide describes how to collect application and container logs in Kubernetes using the Logging operator, and how to send them to Grafana Loki.
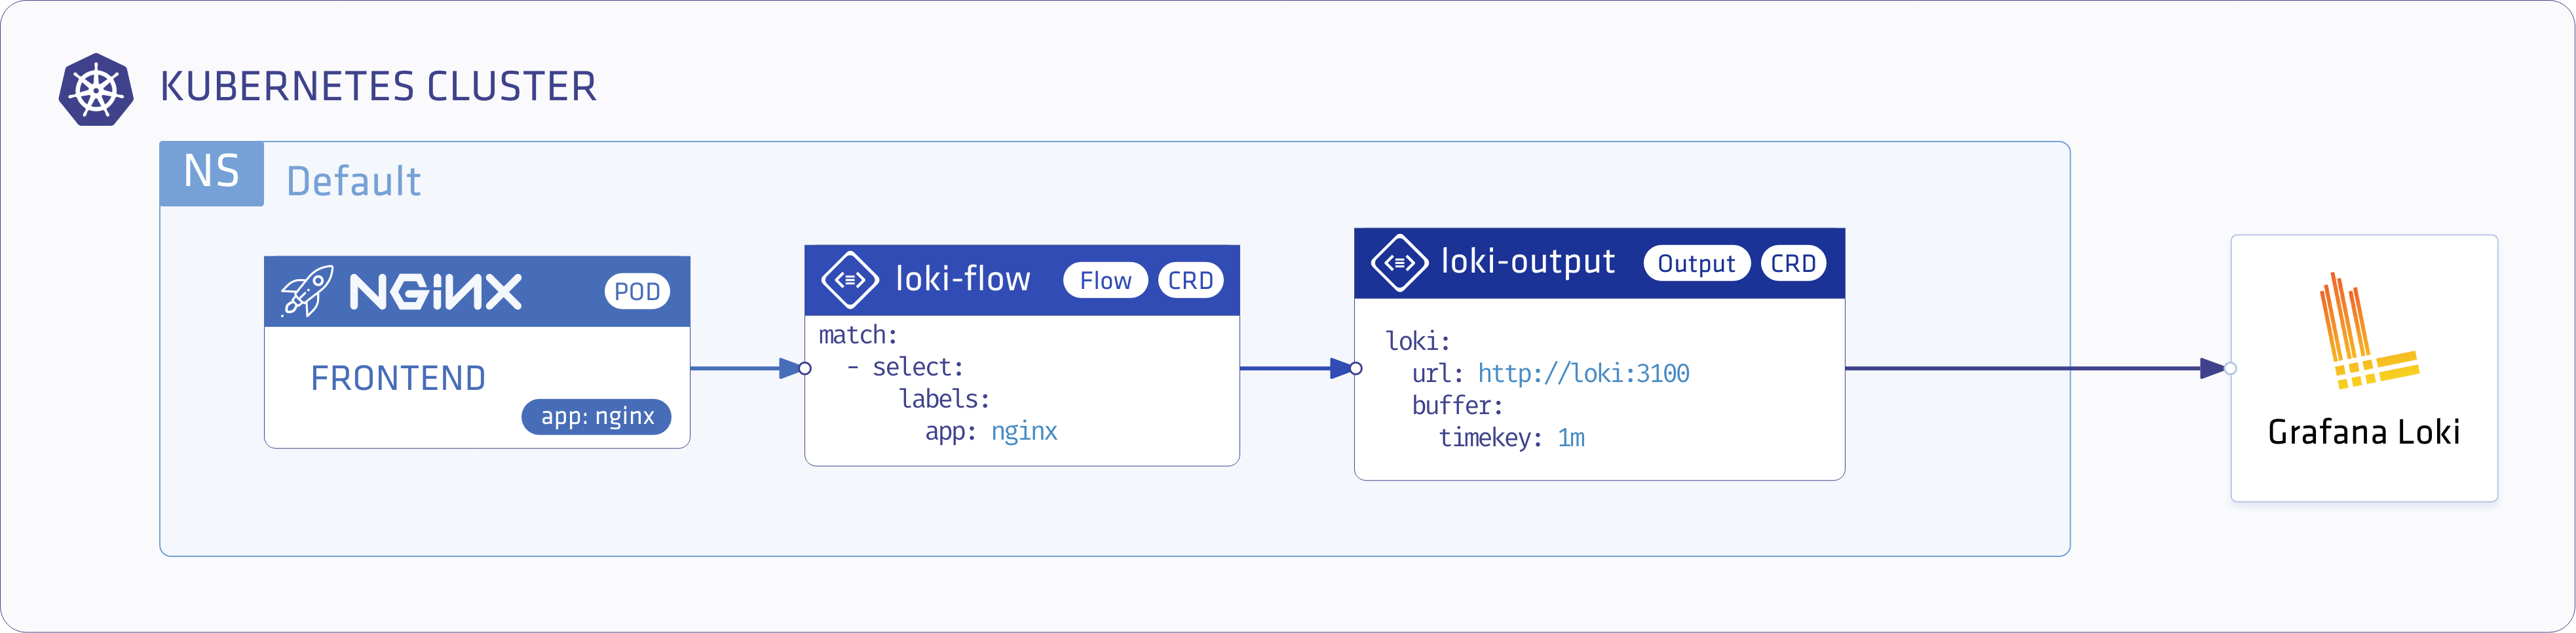
The following figure gives you an overview about how the system works. The Logging operator collects the logs from the application, selects which logs to forward to the output, and sends the selected log messages to the output. For more details about the Logging operator, see the Logging operator overview.
Deploy Loki and Grafana
-
Add the chart repositories of Loki and Grafana using the following commands:
helm repo add grafana https://grafana.github.io/helm-charts helm repo update -
Install Loki into the logging namespace:
helm upgrade --install --create-namespace --namespace logging loki grafana/lokiExpected output:
Release "loki" does not exist. Installing it now.
NAME: loki
LAST DEPLOYED: Wed Aug  9 10:58:32 2023
NAMESPACE: logging
STATUS: deployed
REVISION: 1
NOTES:
***********************************************************************
Welcome to Grafana Loki
Chart version: 5.10.0
Loki version: 2.8.3
***********************************************************************

Installed components:
* grafana-agent-operator
* gateway
* read
* write
* backend
For details, see the Grafana Loki Documentation
-
Install Grafana into the logging namespace:
 helm upgrade --install --create-namespace --namespace logging grafana grafana/grafana \
 --set "datasources.datasources\\.yaml.apiVersion=1" \
 --set "datasources.datasources\\.yaml.datasources[0].name=Loki" \
 --set "datasources.datasources\\.yaml.datasources[0].type=loki" \
 --set "datasources.datasources\\.yaml.datasources[0].url=http://loki:3100" \
 --set "datasources.datasources\\.yaml.datasources[0].access=proxy"
Expected output:
Release "grafana" does not exist. Installing it now.
NAME: grafana
LAST DEPLOYED: Wed Aug  9 11:00:47 2023
NAMESPACE: logging
STATUS: deployed
REVISION: 1
NOTES:
1. Get your 'admin' user password by running:

  kubectl get secret --namespace logging grafana -o jsonpath="{.data.admin-password}" | base64 --decode ; echo
...
Deploy the Logging operator and a demo application
Install the Logging operator and a demo application to provide sample log messages.
Deploy the Logging operator with Helm
To install the Logging operator using Helm, complete the following steps.
Note: You need Helm v3.8 or later to be able to install the chart from an OCI registry.
-
Install the Logging operator into the logging namespace:
helm upgrade --install --wait --create-namespace --namespace logging logging-operator oci://ghcr.io/kube-logging/helm-charts/logging-operatorExpected output:
Release "logging-operator" does not exist. Installing it now.
Pulled: ghcr.io/kube-logging/helm-charts/logging-operator:4.3.0
Digest: sha256:c2ece861f66a3a2cb9788e7ca39a267898bb5629dc98429daa8f88d7acf76840
NAME: logging-operator
LAST DEPLOYED: Wed Aug  9 11:02:12 2023
NAMESPACE: logging
STATUS: deployed
REVISION: 1
TEST SUITE: None
Note:
-
Helm has a known issue in version 3.13.0 that requires users to log in to the registry, even though the repo is public.
Upgrade to 3.13.1 or higher to avoid having to log in, see: https://github.com/kube-logging/logging-operator/issues/1522
-
If you’re installing the Helm chart from Terraform, reference the repository as
repository = "oci://ghcr.io/kube-logging/helm-charts/"(without thelogging-operatorsuffix). Otherwise, you’ll get a 403 Forbidden error.
-
-
Create the
loggingresource.kubectl -n logging apply -f - <<"EOF" apiVersion: logging.banzaicloud.io/v1beta1 kind: Logging metadata: name: default-logging-simple spec: fluentd: {} fluentbit: {} controlNamespace: logging EOFNote: You can use the
ClusterOutputandClusterFlowresources only in thecontrolNamespace. -
Create a Loki
outputdefinition.kubectl -n logging apply -f - <<"EOF" apiVersion: logging.banzaicloud.io/v1beta1 kind: Output metadata: name: loki-output spec: loki: url: http://loki:3100 configure_kubernetes_labels: true buffer: timekey: 1m timekey_wait: 30s timekey_use_utc: true EOFNote: In production environment, use a longer
timekeyinterval to avoid generating too many objects. -
Create a
flowresource.kubectl -n logging apply -f - <<"EOF" apiVersion: logging.banzaicloud.io/v1beta1 kind: Flow metadata: name: loki-flow spec: filters: - tag_normaliser: {} - parser: remove_key_name_field: true reserve_data: true parse: type: nginx match: - select: labels: app.kubernetes.io/name: log-generator localOutputRefs: - loki-output EOF -
Install log-generator to produce logs with the label
app.kubernetes.io/name: log-generatorhelm upgrade --install --wait --create-namespace --namespace logging log-generator oci://ghcr.io/kube-logging/helm-charts/log-generator
Validate the deployment
Grafana Dashboard
-
Use the following command to retrieve the password of the Grafana
adminuser:kubectl get secret --namespace logging grafana -o jsonpath="{.data.admin-password}" | base64 --decode ; echo -
Enable port forwarding to the Grafana Service.
kubectl -n logging port-forward svc/grafana 3000:80 -
Open the Grafana Dashboard: http://localhost:3000
-
Use the
adminusername and the password retrieved in Step 1 to log in. -
Select Menu > Explore, select Data source > Loki, then select Log labels > namespace > logging. A list of logs should appear.
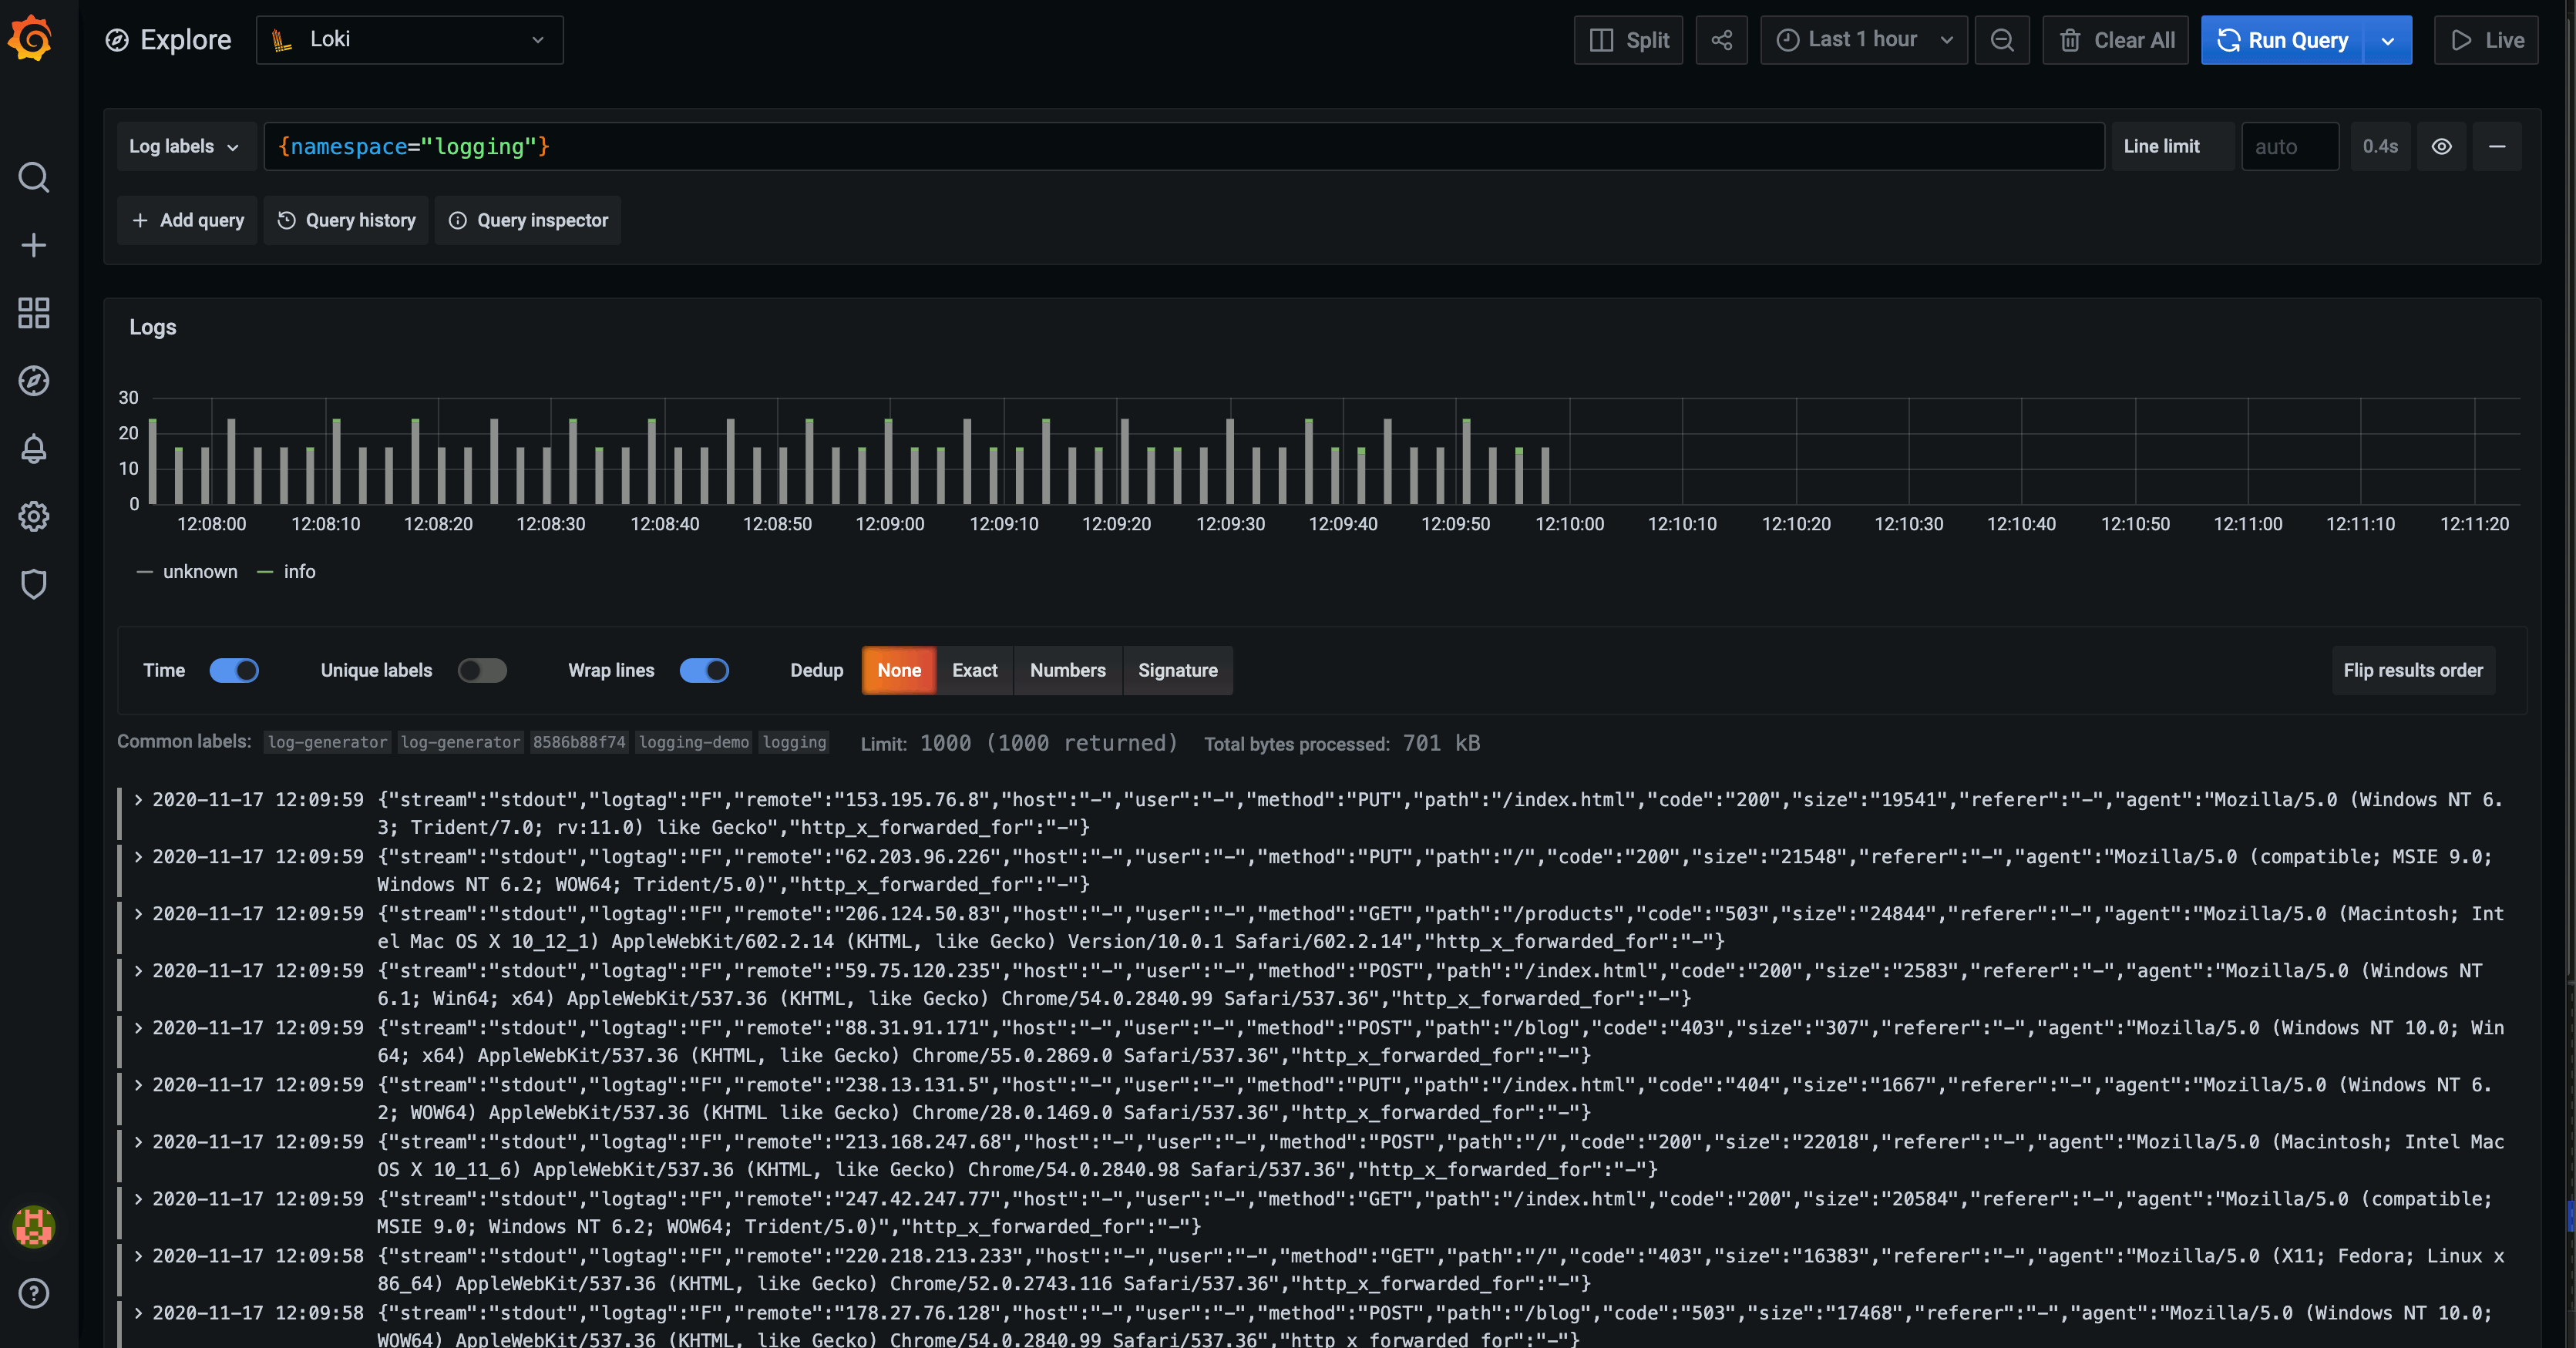
If you don’t get the expected result you can find help in the troubleshooting section.